Machine Learning Concept (Scikit-learn)
Table of Contents
1) เบื้องต้น
- machine learning เป็นอีกเทคนิคหนึ่งที่ใช้ในการประมวลผลข้อมูลจำนวนมาก
- library สำหรับทำ machine learning เบื้องต้นใน python ชื่อว่า
sklearn - machine learning เป็นเนื้อหาที่กว้างมาก แลบนี้เพียงแค่นำเนื้อหาเสี้ยวเล็กๆ มาแนะนำเท่านั้น
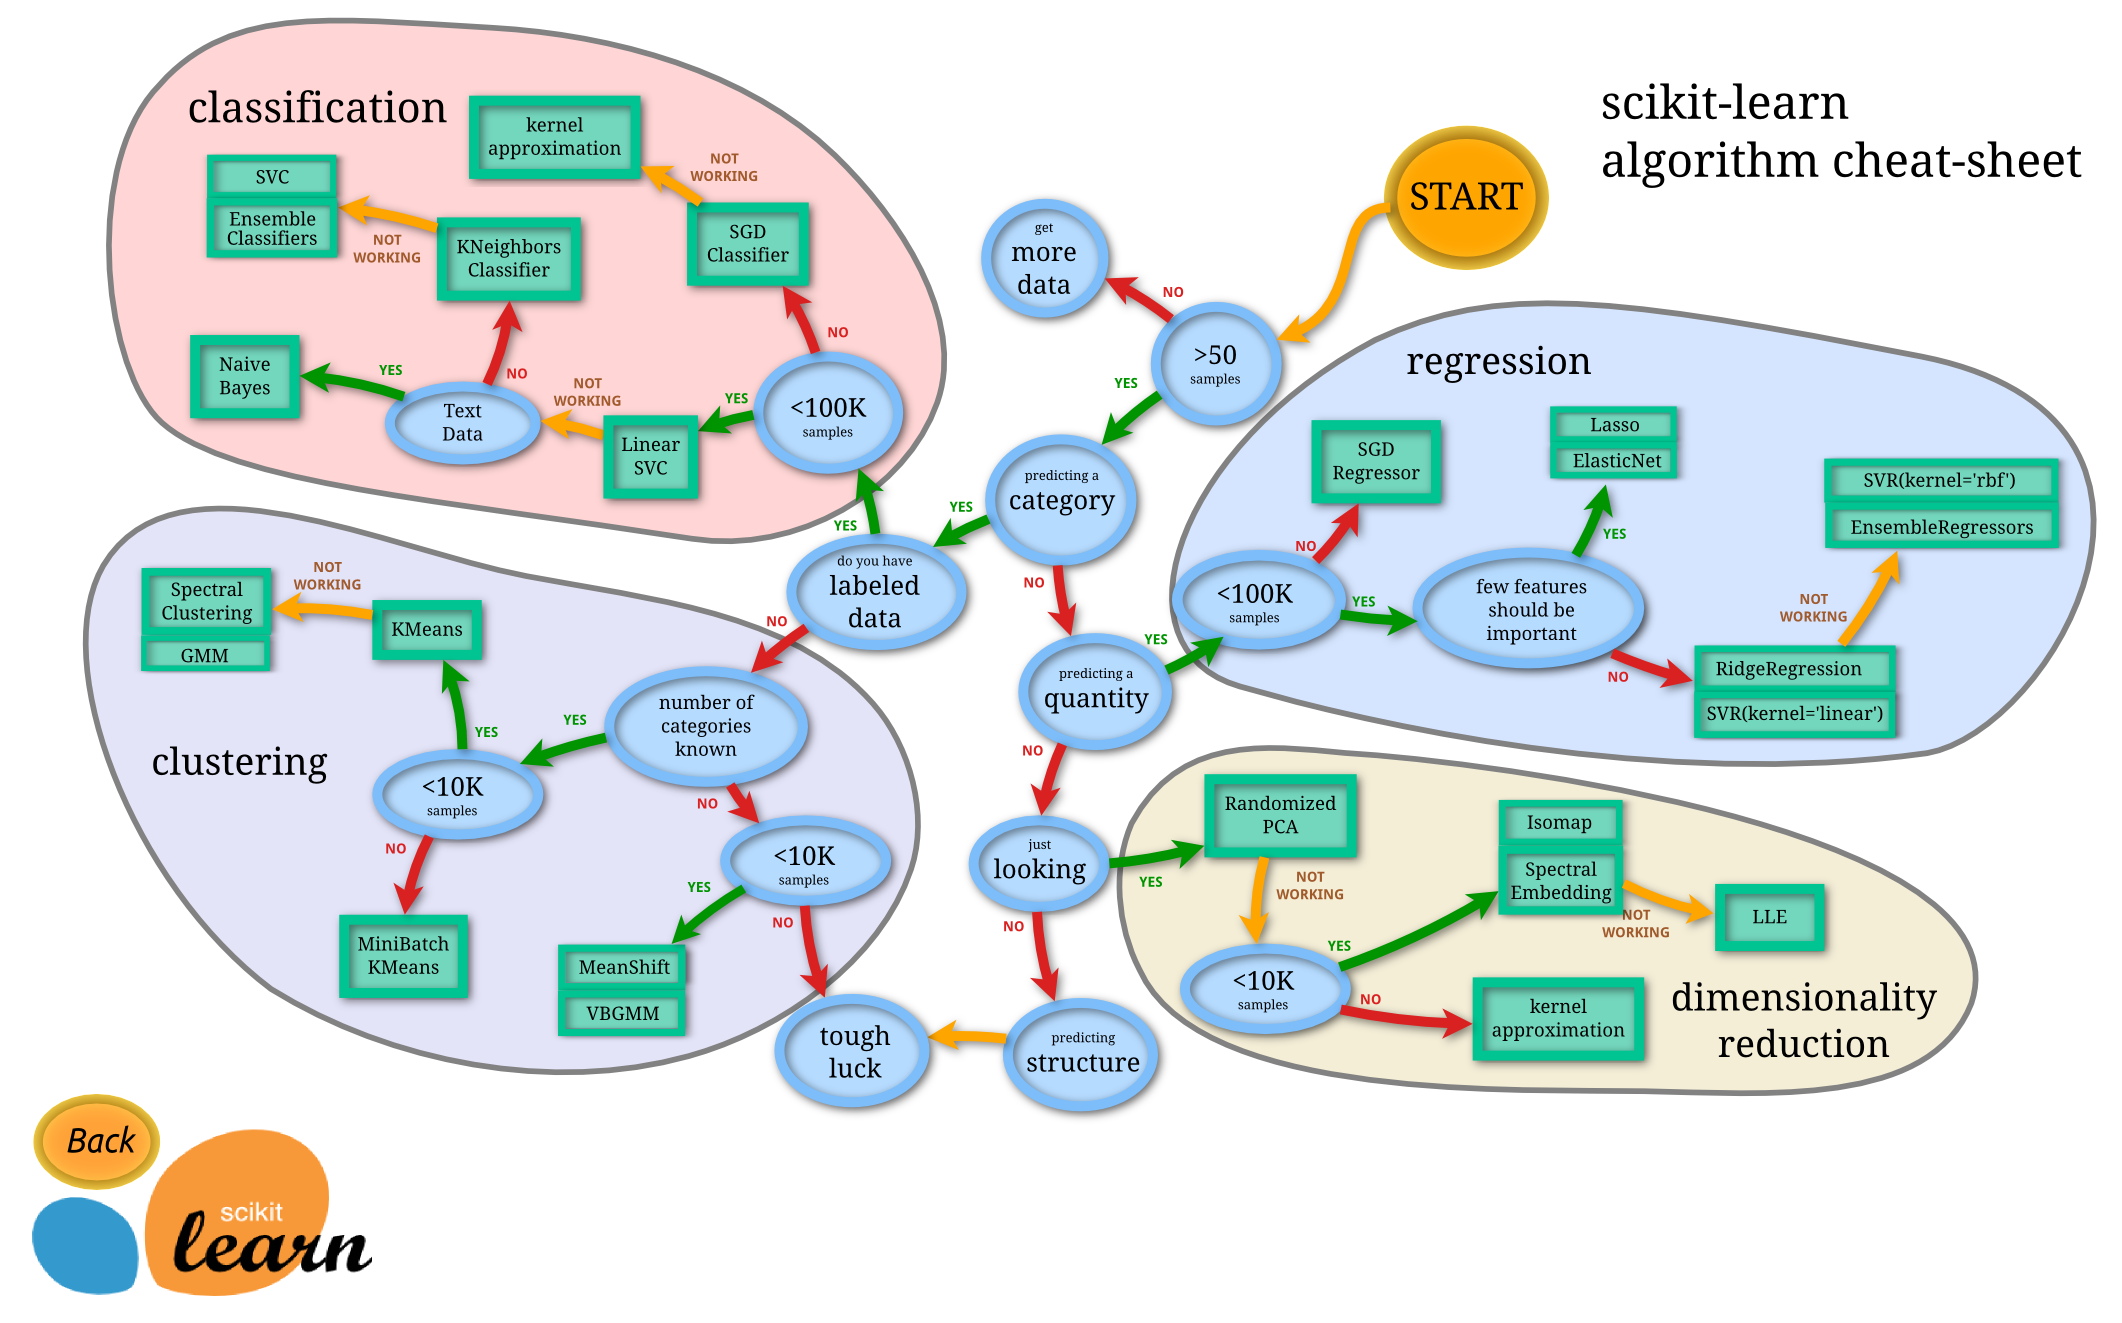
- แผนภาพด้านล่างเป็นสิ่งที่
sklearnสามารถทำได้ที่เกี่ยวกับการทำ machine learning ซึ่งประกอบด้วย- classification
- regression
- clustering
- dimensionality reduction
- ในแลบนี้จะแสดงตัวอย่างของการทำ machine learning ประเภท
- regression
- classification แบบเบื้องต้นมากๆ
2) Regression
!pip install scikit-learn eli5
import pandas as pd
เริ่มต้นด้วยการนำเข้าข้อมูลด้วย pandas ตามปกติ
df = pd.read_json('https://raw.githubusercontent.com/vega/vega-datasets/master/data/gapminder.json')
df.head()
| year | country | cluster | pop | life_expect | fertility | |
|---|---|---|---|---|---|---|
| 0 | 1955 | Afghanistan | 0 | 8891209 | 30.332 | 7.7 |
| 1 | 1960 | Afghanistan | 0 | 9829450 | 31.997 | 7.7 |
| 2 | 1965 | Afghanistan | 0 | 10997885 | 34.020 | 7.7 |
| 3 | 1970 | Afghanistan | 0 | 12430623 | 36.088 | 7.7 |
| 4 | 1975 | Afghanistan | 0 | 14132019 | 38.438 | 7.7 |
ข้อมูลเป็นชุดข้อมูลเดียวกันแลบ Data Visualization คือ
fertility: อัตราการเกิดlife_expect: อายุขัยpop: จำนวนประชากร
สำหรับแต่ละประเทศและปีที่เก็บข้อมูล และมีคอลัมน์
cluster: กลุ่มอะไรบางอย่าง
ในการทำ regression ให้เราระบุว่าจะใช้คอลัมน์ไหนเป็น input/output ได้ดังนี้
regression_features = ["pop","fertility"]
regression_X = df[regression_features]
regression_y = df["life_expect"]
โดย X (input) ประกอบด้วย
popfertility
และ y (output) เป็น life_expect
สังเกตได้ว่า life_expect เป็นปริมาณ จึงใช้กระบวนการ regression
จากนั้น เราสามารถเริ่มสร้างโมเดล machine learning จาก sklearn
from sklearn.linear_model import LinearRegression
reg = LinearRegression()
โดยโมเดลแรกที่เราจะใช้คือ LinearRegression ที่เราเรียกมาจาก sklearn.linear_model
และ reg = LinearRegression() เป็นการสร้างโมเดลนั้นขึ้นมา
แต่จะยังไม่มีการเรียนรู้เกิดขึ้นในกระบวนการนี้ ต้องใช้คำสั่งถัดไปคือ
reg.fit(regression_X, regression_y)
reg.fit(input, output) เป็นการสั่งให้โมเดล reg เรียนรู้จากข้อมูลที่เรากำหนด
หลังจากที่โมเดลเรียนรู้จากข้อมูลแล้ว เราสามารถดูสิ่งที่โมเดลได้เรียนรู้ได้ด้วยแพคเกจ eli5 (เป็นเนื้อหาเสริม สามารถไปค้นหาเพิ่มเติมเองได้)
ผลลัพธ์ของโมเดลจะเรียกว่า weight สามารถลองดูได้ตามด้านล่าง
import eli5

eli5.show_weights(reg, feature_names = regression_features)
y top features
| Weight? | Feature |
|---|---|
| +84.422 | <BIAS> |
| -0.000 | pop |
| -4.968 | fertility |
โดยโมเดล LinearRegression จะเป็นสมการเชิงเส้น มีลักษณะเป็น
y = \beta_0 + \beta_1 x_1 + \beta_2 x_2
ซึ่งจากตาราง โมเดลนี้จะได้ค่าออกมาเป็น
life\_expect = 84.422 - 4.968 \times fertility
fertility เพิ่มขึ้น 0.1 แล้ว ค่า life_expect จะมากกว่าเดิมเท่าไร (ปัดทศนิยมสองตำแหน่ง)

ตารางด้านบนแสดงน้ำหนักของแต่ละคอลัมน์ใน input ที่ส่งผลต่อ output
ต่อไปเป็นโมเดลประเภท regression เช่นกันแต่เป็นโมเดล RandomForestRegressor
from sklearn.ensemble import RandomForestRegressor
rf_reg = RandomForestRegressor(n_estimators=10)
rf_reg.fit(regression_X, regression_y)
n_estimators เป็นรายละเอียดย่อยเฉพาะของโมเดล RandomForestRegressor ซึ่งเป็นจำนวน Decision Tree ย่อยที่โมเดล Random Forest จะสร้างขึ้นมา
eli5.show_weights(rf_reg, feature_names = regression_features)
| Weight | Feature |
|---|---|
| 0.8759 ± 0.0303 | fertility |
| 0.1241 ± 0.0303 | pop |
weight ของ RandomForestRegressor จะแสดงถึง feature importance (ความสำคัญของตัวแปร) แต่ไม่ได้แสดงถึงค่าโดยตรงเหมือน LinearRegression
(คำถามอธิบาย ไม่ต้องโค้ด) ให้อธิบายขั้นตอนการใช้งาน machine learning model ด้วยแพคเกจ sklearn
Hint: ในตัวอย่างมีสามบรรทัด แต่ละบรรทัดระบุถึงขั้นตอนอะไร
3) Classification
ต่อไปนี้จะเป็นตัวอย่างของ machine learning ประเภท classification
โดยเราจะกำหนด output เป็น cluster แทน life_expect ซึ่งเป็นข้อมูลเชิงคุณภาพ จากเดิมเป็นเชิงปริมาณ
df["cluster"].describe()
count    693.000000
mean       2.476190
std        1.446971
min        0.000000
25%        1.000000
50%        3.000000
75%        3.000000
max        5.000000
Name: cluster, dtype: float64
classification_features = ["pop", "life_expect", "fertility"]
classification_X = df[classification_features]
classification_y = df["cluster"]
โมเดล svm เป็นโมเดล classification รูปแบบหนึ่ง
from sklearn import svm
sv = svm.LinearSVC()
sv.fit(classification_X, classification_y)
eli5.show_weights(sv, feature_names = classification_features)
| y=0 top features | y=1 top features | y=2 top features | y=3 top features | y=4 top features | y=5 top features | ||||||||||||||||||||||||||||||||||||||||||||||||||||||||||||
|
|
|
|
|
|
อีกหนึ่งโมเดลตัวอย่างคือ RandomForestClassifier
from sklearn.ensemble import RandomForestClassifier
clf = RandomForestClassifier(n_estimators=10)
clf.fit(classification_X, classification_y)
eli5.show_weights(clf, feature_names = classification_features)
| Weight | Feature |
|---|---|
| 0.3475 ± 0.0711 | pop |
| 0.3346 ± 0.0998 | life_expect |
| 0.3179 ± 0.0782 | fertility |
cluster มากที่สุด
ต่อไปหากจะทำการลองทดสอบข้อมูลที่สมมุติขึ้นมา โดยดูรูปแบบข้อมูลที่ใช้กับโมเดลจาก training data ก่อน
classification_X.iloc[0]
pop            8891209.000
life_expect         30.332
fertility            7.700
Name: 0, dtype: float64
จะเห็นว่าจะต้องใส่สามค่า ซึ่งสามารถใช้ np.array สร้างขึ้นมาได้
import numpy as np
เช่น สมมุติว่า
popเป็น 4000000life_expectเป็น 30fertilityเป็น 7
to_predict = np.array([4000000, 30, 7])
แล้วสามารถใช้ค่านี้ไป predict ได้
eli5.show_prediction(clf, to_predict, feature_names = classification_features,
                show_feature_values=True)
| y=0 (probability 0.100) top features | y=1 (probability 0.000) top features | y=2 (probability 0.700) top features | y=3 (probability 0.200) top features | y=4 (probability 0.000) top features | y=5 (probability 0.000) top features | ||||||||||||||||||||||||||||||||||||||||||||||||||||||||||||||||||||||||||||||||||||||||||
|
|
|
|
|
|
จงหาค่า pop, life_expect, fertility ที่ทำให้โมเดลทำนายออกมาเป็น cluster ที่ อ. กำหนด